Introduction to Python best practices in the sciences.
Starting with scientific programming in Python?
Triggered by a question from a colleque, I'm going to write a litte about
the tools, best practices and techniques I use when developing scientific data analysis software in Python.
Working in the sciences, like Astronomy in my case, one often writes
short code snippets, which are run once or twice to produce plots to
show at the next meeting but throw away the scripts afterwards. These
scripts and their use are very different from the larger software
products one might also create in the sciences. But often the small
scripts will grow into the larger projects, and then one wishes to
have started differently, with more structure, more tests and the
bigger picture in mind.
The following tools might help to
accomplish the switch from the small snippets to the larger projects
with minimal pain.
Python
Although I will talk about python itself, you should probably read some of the following:- Dive into Python
- Scientific Programming with Python
- The Numpy & Scipy tutorials
- The Matplotlib gallery examples
And if you happen to work in astronomy, you want to visit this site regularly, subscribe to the mailing list, look through the list of packages, etc.:
Small Snippets
The python shell in not very useful for most
tasks. IPython is much better and you will probably be happy with it.
But there is even something better: IPython with the notebook feature switched on!
> ipython notebook --pylab=inlineNow you should have a new tab in your browser, with the dashboard open. IPython Notebook has even the ability to provide a working environment for collaborative editing of the code, but I will not go into details about that.
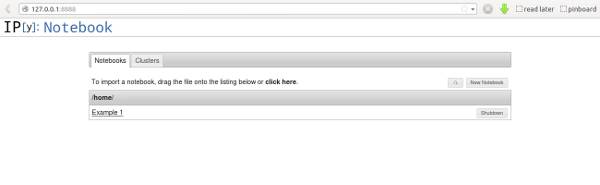 Create a new notebook or open a saved notebook to continue where you
left. In the picture you can see that I have one existing notebook
called "Example1". Selecting this opens a new tab with something looking like this:
Create a new notebook or open a saved notebook to continue where you
left. In the picture you can see that I have one existing notebook
called "Example1". Selecting this opens a new tab with something looking like this:
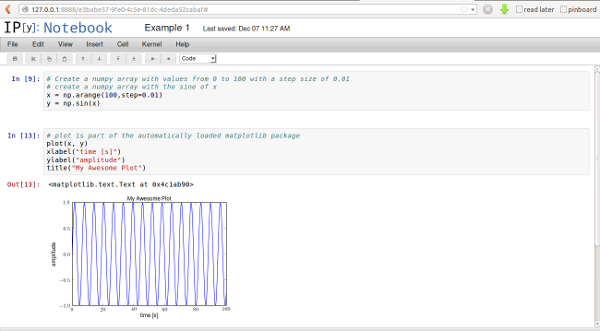 You can see on the left side, that there are connected lines of code
(called "cells"). Its a good idea to group your code a little here,
because you can run code here either in the full notebook or in
individual cells. You can also collapse cell output, helping you in
getting a better overview of your code.
You can see on the left side, that there are connected lines of code
(called "cells"). Its a good idea to group your code a little here,
because you can run code here either in the full notebook or in
individual cells. You can also collapse cell output, helping you in
getting a better overview of your code.A nice feature of the IPython Notebook are the inline plots: just call
plotor a related matplotlib call, and get an inline graphic of the output. Add labels, titles, comments and simply re-run the current cell to get an updated plot!
At some point you might want to turn these small notebooks into a real executeable program. But before you do that, start with something else: turn the logical blocks (the cells) into functions. Structuring your code is important in the long run and this is a good time to start.
Functions in python look like this:
def create_data():
    # Create a numpy array with values from 0 to 100 with a step size of 0.01
    # create a numpy array with the sine of x
    x = np.arange(100,step=0.01)
    y = np.sin(x)
    return x, y
When you are used to other programming languages, it is interesting to
note that in python a function can return more than one variable. In this
case we return two arrays. You would call such function like this:
time, amplitude = create_data()You can do the same with the plotting part.
This is a great starting point to turn your snippet into a real program. Unlike the standard python interpreter sessions, notebooks can be saved into normal python files. This example would result in code like this:
# -*- coding: utf-8 -*-
# <nbformat>3.0</nbformat>

# <codecell>

def create_data(start=0, stop=100, step=0.01):
    # Create a numpy array with values from 0 to 100 with a step size of 0.01
    # create a numpy array with the sine of x
    x = np.arange(start,stop, step)
    y = np.sin(x)
    return x, y

# <codecell>

def plot_results(x, y):
    # plot is part of the automatically loaded matplotlib package
    plot(x, y)
    xlabel("time [s]")
    ylabel("amplitude")
    title("My Awesome Plot")

# <codecell>

time, amplitude = create_data()
plot_results(time, amplitude)

# <codecell>
Python Software
You are working on Linux, right? Great!When you write software, you should follow a number of best prectices. You will likely think that you have better things to do, but in the end, these will help you safe time and frustration:
- Use version control: chose one of:
bazaar, git or mercurial.
Those are state of the art distributet version control systems. All of them are great (don't believe anyone that one of them is superior to the others, they are just slitely different...). But do not choose cvs and svn if you don't have to. - Write tests! Really! Early!
- Let your code accept standard parameters: e.g. "-h", "--help",
- Structure your code into several files, folders (in python: modules, packages)
- Prepare your code for distribution to other people.
The Quickly developers thought the same, so they wrote an app-developer tool that uses templates and shortcut commands to do this boring stuff for you:
Of couse, first you have to install quickly itself (I assume Ubuntu commands here):
> sudo apt-get install quicklyNow, create a new project. Since you will most likely not care about a GUI, choose the CLI (command line interface) template:
> quickly create ubuntu-cli loftsimulator
> cd loftsimulator
> quickly run
It's really a great start for a larger project. All the things I listed above (common arguments, testing, version control...) is taken care of!
Important steps:
- Tell the software who you are in the AUTHORS file.
- Add commandline options in the
file
loftsimulator/__init__.py
- Write tests to make sure your code works. Write the tests first,
actually, and code until the tests pass... Often you will think that a specific part of your code is not testable, because it requires user input, large amounts of data, random numbers, etc, but also most of the time it is then best to structure your code is such a way that you can test most of your code. This not only makes your test coverage better, it mostly results also in easier to understand code.
Running tests is very easy:quickly test
- Once the tests pass, run your code:
quickly run
- Happy with your code? Commit your changes to the version controlsystem:
quickly save "added a great new feature..."
- Need to share the code with other people (using ubuntu)?
quickly package
Now you can give away the newly created package loftsimulation.deb, which others can install with a simpledpkg -i loftsimulation.deb
Plotting with Python
Scientist produce plots all the time, so a plotting library is very important. In Astronomy you will likely have used IDL to do this, in VHE astronomy maybe ROOT.The great thing about scientific programming in Python is the decoupling of analysis (numpy, scipy, sympy, ...) and the graphical output (matplotlib, mayavi2, APLpy, ds9,...). This is very different from ROOT and IDL, where the scientific libraries are also the plotting libraries. The best library/software really depends on what you like and need to do.
I often use matplotlib and kapteyn, which is a nice extension to the matplotlib library with tools specifically for astronomy.